
Article

Cybersecurity
CISO-as-a-service consulting: posture, remediation roadmap, ongoing support.
Discover →
Linux Services & Systems
Domains, hosting, PEC, email infrastructure, network services and Linux systems. Open Source infrastructure support and management.
Discover →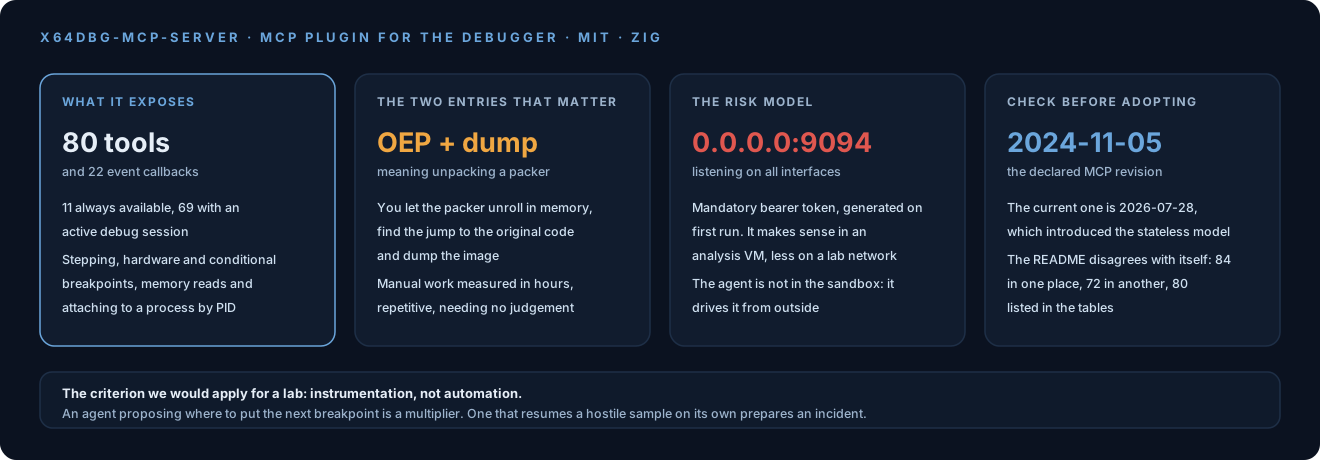
x64dbg-mcp-server is a native plugin for x64dbg, the open source Windows debugger, exposing its functions over the Model Context Protocol on HTTP. The repository opened on 22 August, MIT licence, and passed 1,800 stars within two weeks.
It is written in Zig, with no dependencies, producing a single binary and building both x32 and x64 from one command, cross-compiling from Linux or macOS to Windows. No .NET runtime, no Python, no framework: the file is copied into the plugins folder and the MCP server starts on its own when the debugger launches.
What it puts in an agent’s hands
The tool list is the part that says most, because it describes a workflow rather than a feature. We counted 80 in the README tables, split into 11 always available and 69 requiring an active debug session.
| Area | Operations exposed |
|---|---|
| Execution control | run, StepInto, StepOver, StepOut, PauseDebug, RestartDebug |
| Breakpoints | INT3, hardware on DR0-DR3 for read, write or execute, conditional with expression and log |
| Memory and code | Disassemble, DisassembleFunction, ReadMemory, allocation, pattern scanning |
| Reconnaissance | SearchForStrings, xrefs, symbols, modules, threads, call stack |
| Format analysis | PE analysis, OEP detection, module dumping, PEB and SEH inspection |
| Process attachment | AttachProcess by PID, LoadBinary, ExecuteDebuggerCommand |
Two entries deserve reading together, because they are not generic. OEP detection, meaning the original entry point, together with module dumping are the two steps for unpacking a compressed or obfuscated executable: you let the packer unroll itself in memory, find the point where it jumps to the original code and dump the reconstructed image from there. It is manual, repetitive work measured in hours. It is exactly the kind of activity an agent can carry out through repeated attempts.
Then there is one tool that makes the rest possible: WaitForEvent, a long poll on debugger events. Without it an agent would have to poll the state in a loop; with it, it can stop and wait for a breakpoint to fire or an exception to arrive. Together with the 22 event callbacks the plugin registers, among them DLL load and unload, thread creation and exceptions, it is what turns a debugger into something an agentic loop can drive.
The link with Friday’s figures
This is the same capability appearing in the GPT-6 Astra announcement four days ago, where the highest number in any of the tables is 88% on SRE-Bench at the first attempt, against 55.9% for the previous model and 12.5% for the runner-up.
SRE-Bench measures the ability to understand a binary’s logic without having the source. A plugin like this is the missing piece between that capability and a real sample: the model can read a binary, and from here it gets the ability to run it one instruction at a time, look at its memory and observe its behaviour.
The risk model, read in full
It is worth stating in full, because the project hides nothing and the choices made have a context.
The server listens on 0.0.0.0:9094 for the 64-bit build and on 0.0.0.0:9095 for the 32-bit one, meaning on all interfaces rather than loopback only. Authentication is mandatory, with a bearer token generated on first run and required on every call. Address, port and token can be changed from the plugins menu.
Context matters: x64dbg is almost always used inside an analysis virtual machine isolated from the network, where binding on all interfaces is precisely what lets the MCP client reach it from the host. On a less carefully built lab network it is instead a reachable service that commands a debugger, so it belongs on the list of things to check before leaving it running.
There is also a containment consideration about the whole arrangement. Here the agent does not run inside the sandbox: it drives it from outside, while the sample under analysis runs in the machine the debugger controls. It is a different geometry from the one we wrote about in harness and sandbox, where the problem was confining model-generated code. The boundary to design here is not around the agent but around the analysis machine, and the practical question is what happens if the sample tries to break out while an automated process is setting breakpoints on it.
Two things to check before adopting it
The protocol revision. The README declares MCP 2024-11-05, with Streamable HTTP and SSE transports over JSON-RPC 2.0. That is a revision from nearly two years ago: the current one is 2026-07-28, which we covered in August and which introduced the stateless model and deprecated some parts. It is not a defect in itself, since older clients keep working, but anyone standardising on a recent version should know this plugin speaks an earlier dialect.
The tool count. The README is not consistent with itself: the features section declares 84 tools, the Tools section heading declares 72, and the tables list 80. It is a small detail, flagged because when assessing a tool that will be put in an agent’s hands, the count of exposed capabilities is exactly the number a security review starts from.
What we think
For anyone doing analysis the value is concrete rather than theoretical. Triaging a sample is made of long, known sequences: attach to the process, set a breakpoint on the suspicious API, run, look at the registers, search for the string, repeat. These are the sequences that cost expert time without requiring expert judgement, and they are the ones an agentic loop can walk. The judgement stays where it always was, in deciding what is worth looking at and in reading what came out.
The criterion we would apply in assessing it for a lab is to treat it as instrumentation, not automation. An agent proposing where to put the next breakpoint and summarising what it saw is a multiplier. An agent deciding on its own to resume a hostile sample on a machine attached to the corporate network is an incident in preparation. The difference between the two is not in the plugin but in how the environment around it is designed.
On the project itself, choosing Zig with zero dependencies and a single binary is the right call for a plugin that has to live inside a debugger: less surface, no runtime to keep updated, plus the ability to build it for Windows from a machine that does not run Windows. It is the kind of sober engineering rarely seen in this area.